
Your gross profit margin (sales minus cost of goods sold) is one of the most important numbers that buyers will look at when assessing your company.
Many sellers end up selling themselves short, though, because they incorrectly calculate their cost of goods sold (COGS) and/or they don’t break their gross profit margin (GPM) up by revenue type/line of business (LOB).
Both of these mistakes can cause a seller to leave A LOT of money on the table, which is not what you want after years of building your business and getting prepared for a sale.
So let’s discuss why and how to avoid these errors, so you can get top dollar for your company.
How To Correctly Report Cost of Goods Sold
Before you waive off this topic as being drier than dry, let me share a little tidbit of information with you:
Not getting this number or percentage right, is the single most likely item that will decrease your eventual sales price – even after a Letter of Intent has been issued!
Here is why….
- Buyers look at this number, or really the gross profit margin, as a barometer of how well the business can do in the future. A strong gross profit margin means as sales increase, bottom line will increase at a much higher number.
- If your company is acquired by a strategic buyer or as a tuck-in into a portfolio company, the buyer will most likely minimize (to the greatest extent possible) the general and administrative expenses you typically find below the line* to gain strategic and accretive value.
- It might hide your most profitable line of business. Which ideally is your recurring revenue.
Understating the cost of sales will overstate the gross profit margin (GPM), which your offer will most likely will be based on. Once a quality of earnings report is completed by the buyer, this overstated gross profit margin will drop. In turn, so will your offer, as savvy buyers know the gross profit margins of similar companies.
We call that “retrading,” which absolutely no seller wants!
Nothing is more gut-wrenching than having an offer drop by potentially millions because the gross profit margin was overstated. Many times, this will kill the deal altogether, as the seller had an expectation that will no longer be met; or if the deal does go through, the transaction starts out on the wrong foot, as the seller will not be happy that the offer was reduced.
Now I have also seen the opposite happen, where the seller had all their sales and marketing expenses added in their cost of sales, thus reducing the gross profit margin. This is unfortunate as well, because once the buyer makes an offer, they typically don’t want to come back with something higher because you made an error in calculating this number.
As you can see, neither scenario has a positive outcome for the seller, and no one ends up happy. This is exactly why I spend a good amount of time with my sellers’ financials, reviewing this number to make sure it is as accurate and correctly stated as possible.
What belongs in the cost of sales calculation?
Let’s get clear on what really belongs in this very important number on your P&L:
- Materials, software, people – that’s pretty obvious
But most people miss the following items:
- Payroll taxes, benefits (medical, vision, dental)
- Bonuses related to these employees
- External applications used to produce the revenue
- Any infrastructure costs used to produce the revenue – internal servers, etc.
- Any independent contractors or outside services used to deliver the products and services
- Any other expenses used to service revenue.
- NOT sales or marketing expenses!
Below is a good example of a typical cost of goods sold section, which is broken down by two lines of business: cloud software and consulting services.
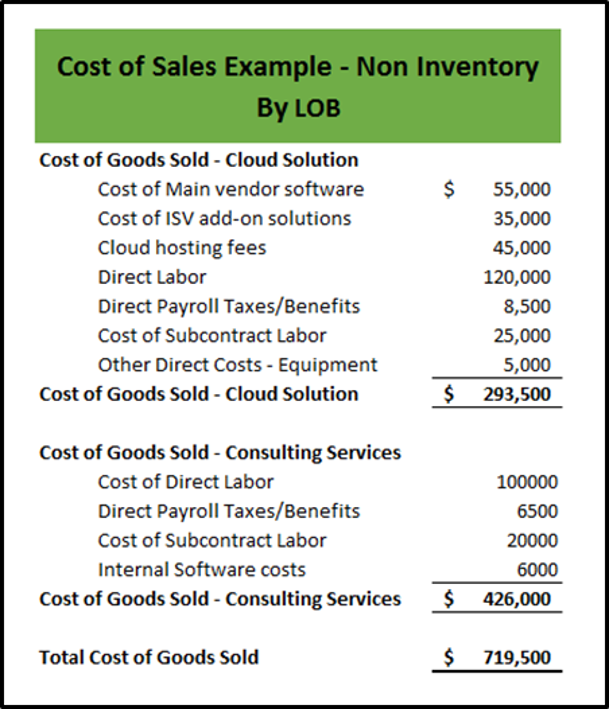
If you are an owner that also bills or provides services to your clients, you will want to allocate at least some of your labor in the cost of sales and put the remaining (administrative time) down below in the general and administrative section.
I do get asked often about benefits and how those should be handled. I typically like to see all medical, dental, and vision benefits up in the cost of sales, but I typically take the profit sharing out and put that in the general and administrative section because those may or may not be offered in its entirety by the new buyer. Plus, if you are maximizing your 401K or SEP plans, you will want to keep those separated from other benefits.
Even though all of these expenses ultimately end up in the final net income number, it is important to break them out so the buyers can compare your gross profit margins against their own, as well as industry benchmarks if they are buying a new line of business (more on that below).
What are the best-in-class margins you should be striving for?
Unfortunately, there is no simple answer to that, and it also depends on which type of partner you are: VAR, MSP, CSP, ISV, or Custom Developer. Gross profit margins range considerably from 25% – 75%, depending upon the partner category. There is, however, a range of percentages to which every partner should try to aspire to, which will be most attractive to any buyer if managed consistently. Consistency is really the key to success.
If you are unclear on margins, find out which category you fall into: below average, average, optimal, and high growth.
Now that we understand how to correctly report COGS, let’s discuss why and how you should separate it to calculate gross profit margins by revenue type.
How To Calculate Gross Profit Margin by Revenue Type/Line of Business
You know by now that not every revenue item carries the same amount of weight, right?
Well, I didn’t. And when I sold my second company, while I knew my margins for hardware and software sales, I had no idea what my margins were for consulting, technical support, or user groups and classes (“lines of business” or LOB) that I offered. Everything was lumped together in my cost of goods sold (COGS) section.
I didn’t know that buyers look at margins by revenue type, and value them differently!
I had no idea (other than a good gut feel) which one of my revenue line items were more profitable than others…until an advisor forced this exercise on me.
Ideally, if you have revenue over $1M, you are breaking it down by type. But now is also the time to take the next step and break it out in the cost of sales section of your financials as well.
Take a look at the chart below. This is a deep dive based on a survey of IT professionals across multiple lines of business. You can clearly see here that gross profit margins vary greatly by type of revenue.
You cannot possibly benchmark yourself against these numbers if you have two or more types of these revenue items, unless you break out their costs (that includes people costs and overhead). Therefore, you cannot articulate your true value to a prospective buyer.
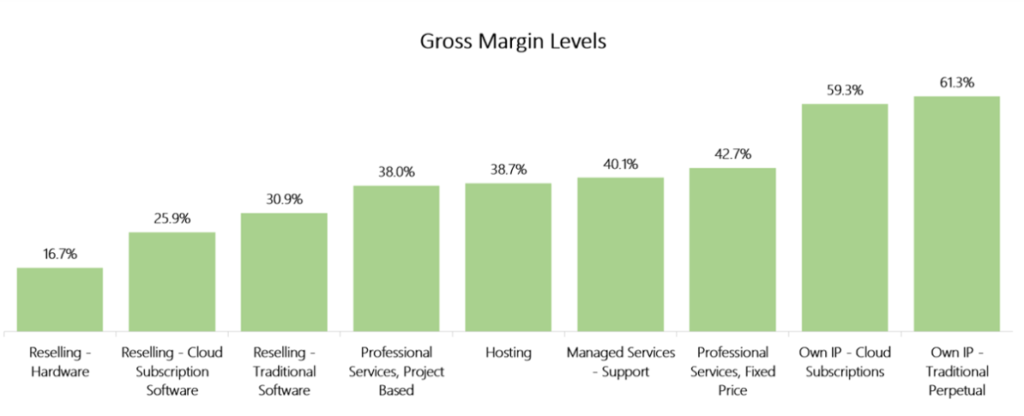
Now that you can see industry benchmark data on margins across revenue line items, it is clear that some are considerably more profitable than others. Just look at the difference between Professional Services revenue by project vs fixed fee.
Of course, your numbers may differ from these, but unless you are able to extract this kind of data from your accounting system, you don’t know how well you are doing against your competition.
What To Do Next
Now that you see the value in separating out your revenue by LOB, let’s get you started on figuring this out for your own organization. Here is what I recommend:
- If you haven’t already, separate out your LOB in the revenue section of your P&L. Anything above 10% should have its own revenue line item.
- Create additional lines in your chart of accounts in the cost of sales to allow you to bucket expenses by revenue type.
- Add the necessary calculations in your accounting system financials to show GPM by LOB.
- Get your billable employees (or those that support the revenue line items) to allocate their time by type – this sounds easy, but in practice is a little more challenging. To get started and keep it simple, you can use an excel spreadsheet. But as you grow, you will need to put some tools in place to allow for this data capture. At a minimum, hourly employees need to record by the hour and salaried employees should allocate by percentage.
While this sounds like a lot of extra work, the benefits can become very large over time. This is especially true as you strive for higher margins year over year, on one or more lines of business.
Once you start getting an idea of your gross margins per LOB, don’t forget to find benchmark numbers specifically in your industry. Most every vendor in the IT industry can provide you with some. Peer groups are another good source of data.
Finally, if you are planning on a transaction in the next couple of years and you are just now embarking on the process of separating out your revenue and cost of sales, you may need to restate prior years’ financials on an estimated basis. Remember, you will need the last three years of financials plus the current year. Many times, I have used the current year’s GPM by LOB percentages and retroactively applied them, assuming no major changes in costs. This may be done via Excel or via a reclass entry officially in the accounting system (ideal).
Now that you understand the correct reporting of cost of goods sold and why you should breakout GPM by LOB, you can begin focusing on increasing your most profitable items and possibly phasing out those that are less profitable.
* Below the line is a generic term used for any numbers on a P&L that are below gross profit margin amount.
 Common Seller Fees in an M&A Transaction