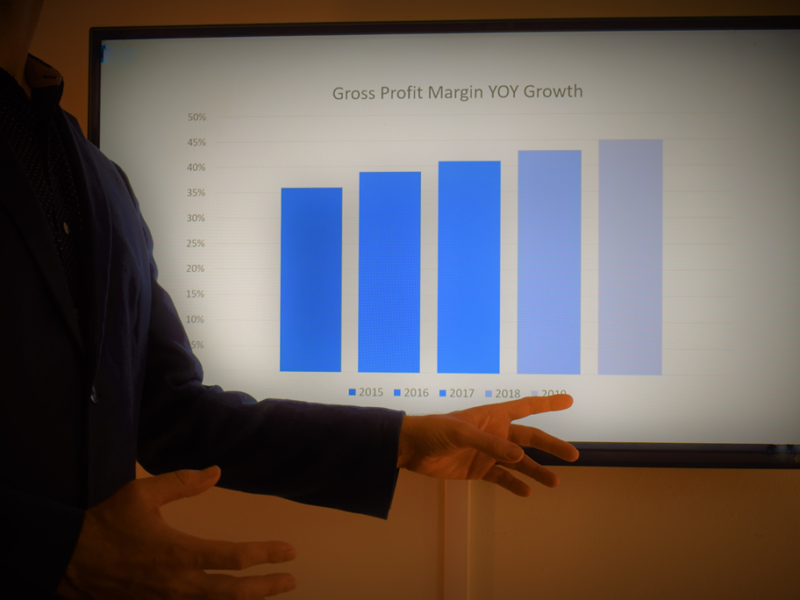
I recently attended (virtually) ITNation Connect 2019, a Managed Service Provider (MSP) conference managed by ConnectWise. Outside of the many Microsoft conferences, it is deemed to be the largest conference for MSPs. As a first-time attendee, I was impressed by the different sessions offered and the speaker list–Joe Panettieri of MSSP Alert & ChannelE2E, Jay McBain, Principal Analyst at Forrester and Gary Pica of TruMethod to name a few. Lots of numbers and metrics were discussed by the various presenters, but my ears really perked up when I heard Gary Pica mention that MSP’s should have a 70% gross profit margin (GPM). I am pretty sure you could hear a pin drop in the audience after that comment. Unless you are a very verticalized MSP or any other variety of partner, that level of gross profit margin is a dream for most and a reality for few. But in today’s hot sellers’ market, a lower GPM doesn’t mean you are not attractive to other buyers.
Hardly a week goes by without hearing of another peer who has either merged or sold to another partner. And, most aren’t earning anything close to 70% gross profit margins but are still receiving great offers for their company.
So what margins are attractive to buyers? Unfortunately, there is no simple answer to that, and it also depends on which type of partner you are: VAR, MSP, CSP, ISV, or Custom Developer. Gross profit margins range considerably from 25% – 75%, depending upon the partner category. There is, however, a range of percentages to which every partner should try to aspire which will be most attractive to any buyer if managed consistently. Consistency really being the key to success.
While researching for my book Get Acquired for Millions, I conducted and reviewed a number of benchmark studies specifically around the profitability of channel partners, as well as an analysis of revenue by employee, and found that partners ultimately fall into four categories: below average, average, optimal, and high growth.
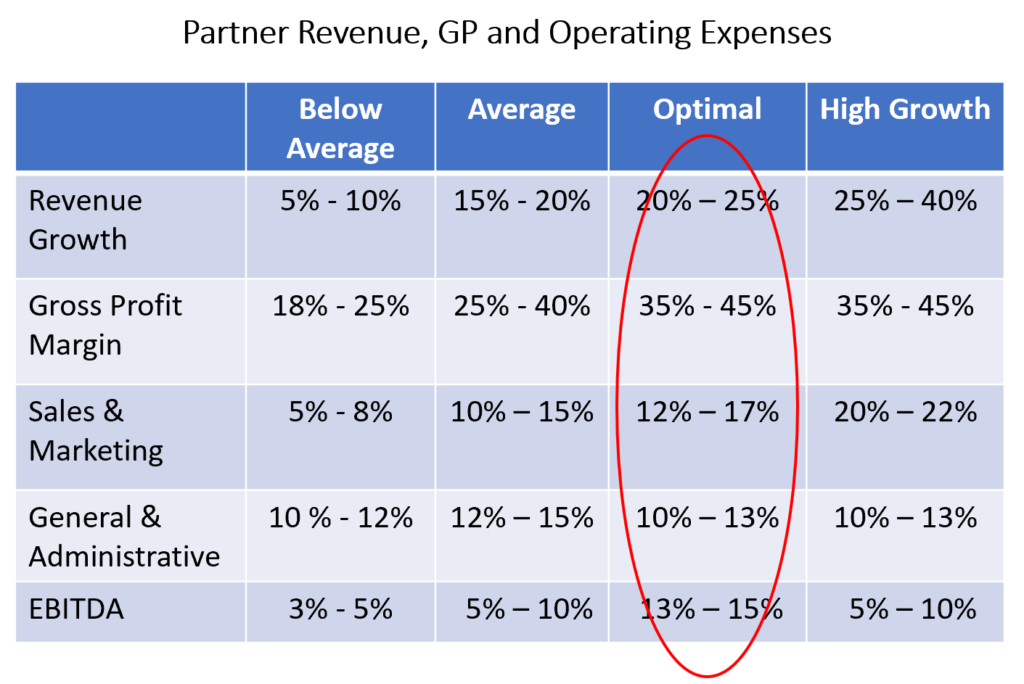
Not surprisingly, more than 25% of channel partners fall into the Below Average category mostly due to low gross profit margins and high sales costs for products that have had margins reduced by vendors. Over the last four years Microsoft has reduced margins considerably for a variety of products. High transaction partners who once received 40 – 50% margins on software, are now only getting 20% – 30%, yet they are maintaining high paying salespeople to sell those solutions. That has resulted in a direct hit to the bottom line and in many cases, net income of less than 5%.
One might assume that the High Growth category is the ideal category to be in. And it is, if you can maintain that level of growth consistently year over year. Generally speaking, for most partners a growth rate of 25% – 40% growth is hard to sustain year over year as revenue increases. And really hard to sustain for more than 3 years in a row, which is what most buyers will look for. That is why the Optimal category is more consistently achievable. Again, consistency being a key factor.
The category labeled Optimal is a more realistic goal for long term growth and viability. You can see that Sales and Marketing expenses are above Average but are not being spent excessively to fund growth, like they are in High Growth. All other expenses such as G&A and gross profit margins are similar to high growth, but without the reduction of EBITDA to below double digits.
In order to aspire to Optimal percentages, partners really need to focus on products and services that will allow them to increase their gross profit margins closer to 45%. Focusing on a particular vertical or creating a variety of fix fee packages that can be sold on a monthly subscription will really help move the needle in that direction. But it doesn’t happen overnight and can take easily three years to reach that goal.
General and Administrative expenses also need to be reduced, from the average of 12% – 15% but this typically will happen organically as the firm grows in size as those are more fixed expenses in nature and can be capped. If expenses are above the Average level, owners should really take a hard look at what is driving up those expenses, and whether solutions can be outsourced for less.
In order to benchmark your company against these metrics, it is truly important to categorize the expenses properly in each of these categories, specifically making sure that all labor associated with creating revenue is allocated to cost of goods sold. For those owners/shareholders who straddle multiple roles within the organization (say admin and sales), it is important to realistically allocate the appropriate time to each category. Not doing so will skew results and not clearly represent results.
Finally, while you can use this as a guide, know that gross profit margins expected from ISV’s are clearly much higher than those of a typical reselling VAR. But ISV’s will also typically have R&D expenses which are not listed here and can account for as much as 20% – 25% of total expenses.
Moving from Below Average to Optimal cannot happen overnight, but it can happen in as little as a few years with the right planning, but at least now you know what you need to strive toward.
Stay tuned for our upcoming post on how your financial statements should be categorized for optimal presentation to a buyer.
 Selecting a Technology M&A Advisor…Success or Disaster?