Most VARs, MSPs, CSPs, and ISVs who consider selling their companies believe all that really matters is top line revenue growth and net income. And well yes, those are important, and yes you do want to see those both moving in the upward direction. And if you are a technology service provider, increasing your monthly subscription revenue is also key, but savvy buyers look for more than just those metrics. Financial buyers specifically, look at other metrics when assessing the future value of your company. Afterall, they are purchasing future, not past performance. Understanding and tracking these additional metrics now will help increase the value of your company, when it comes time to sell.
1. EBITDA – Earnings Before Interest, Taxes, Depreciation and Amortization is the way most buyers measure a company’s operating performance. Essentially, it’s a way to evaluate a company’s performance without having to factor in financing decisions, accounting decisions or tax environments. It doesn’t take into the account the payment of debt because usually in a sale all long-term debt that can be paid off is usually terminated as part of the transaction. For a more detailed explanation of EBITDA, see my post here.
2. Rule of 40 – Mostly used by SaaS companies as a metric, the rule of 40 has become somewhat ubiquitous as a simple financial framework to determine how successful a company is because it measures not only revenue growth but also EBITDA growth. I have seen the rule of 45 used as well, but it is not as prevalent.
What is the rule of 40? Revenue growth rate + profit margin % should be greater than or equal to 40 percent. For clarity purposes, you can assume that the profit margin = operating margin = EBITDA.
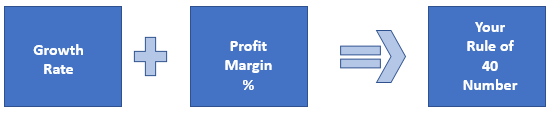
Here is how the rule of 40 looks. If you take your annual revenue growth rate and add it to your EBITDA, that number should be at least 40. Here are a few examples:
- If you are growing 100 percent YOY, you can lose money at a rate of 60 percent of profits.
- If you are growing 40 percent YOY, you should be breaking even.
- If you are growing 20 percent YOY, you should have a 20 percent operating margin.
- If you are not growing, you should have a 40 percent operating margin.
- If your business is declining by 10 percent, you should have a 50 percent operating margin.
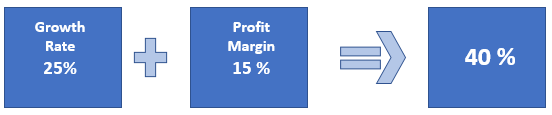
The most realistic example in the technology services industry is a YOY growth rate of 25 percent with an EBITDA rate of 15 percent. That is a very achievable number on both ends of the equation and will attract very qualified buyers, when you decide you want to sell.
If you subscribe to the rule of 45, as mentioned above, you just need to increase those numbers by 5 percent, which makes you a superstar—but in today’s sellers’ market, a rule of 40 will do just fine.
3. Customer Acquisition Costs – Customer acquisition cost (CAC) is a metric that has been growing in use, especially for companies selling SaaS or cloud-based solutions, whether their own product or that of a vendor. Investors look closely at this metric to see if you are spending too much or too little on acquiring new customers. You can calculate this by taking the entire sales and marketing budget divided by the number of new customers acquired in a given period.
This works really well if your sales cycle is short, and where your sales and marketing costs can be tied to new customers in the same period. If it’s longer, you may want to stagger your costs and new customer wins to get a more accurate picture. Looking at this annually, however, is a must.
Here is the actual formula:

For example, if you had total annual sales and marketing expenses of $500K and you acquired 40 new customers in a given year, the calculation would look like this: $500,000/40 = $12,500 CAC.
Costs should include all sales and marketing related expenses + salaries and benefits, commissions, training, and any CRM software costs or other marketing automation software costs.
While we are on the topic of customers, Customer lifetime value (CLV) is another important metric to calculate. This metric determines how much your customer is worth. CLV is the estimated net profit a customer will provide over their lifetime as a paying customer.
If you combine the two ratios, you can get at the more important question: To what extent is a customer worth their cost? In other words, what is the true value of a customer to your business? An ideal CLV: CAC ratio should be at least 3:1. The value of a customer should be three times more than the cost of acquiring them. If the ratio is close, i.e., 1:1, you are spending too much to acquire a customer. If it’s 5:1, you are spending too little.
4. Churn – is a term typically used when discussing SaaS, and also general recurring revenue, and it is the percentage rate at which customers cancel their recurring revenue subscriptions. It is a key metric of SaaS business performance and an important parameter in revenue forecasting. An acceptable churn rate is in the 5 to 7 percent range annually, depending upon whether you measure number of customers or revenue. It is certainly possible to have a lower churn rate, but it is difficult because there are things that are out of your control, such as customer bankruptcies, mergers, and acquisitions that will unexpectedly affect your numbers, regardless of how well your product or customer support is working.
Here is the customer churn formula:
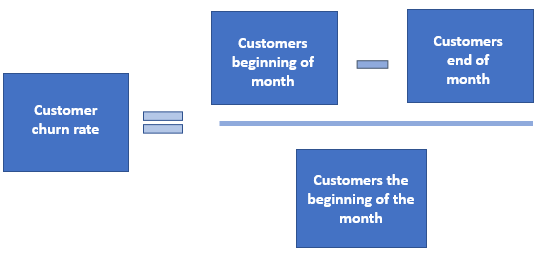
For example, if your company had 500 customers at the beginning of the month and only 475 customers at the end of the month, (exclude any new customer adds for the month) its customer churn rate would be: (500-475)/500 = 5%. Ideally, you want to track this on a quarterly or semi-annual basis, but annually is fine if you have a product that is sticky (i.e. an ERP/CRM or Office365 product that you sell and support).
Can you get a different churn rate if you measure the churn based on revenue rather than the actual number of customers? The answer is yes. This is referred to as revenue churn. Depending on the make-up of your revenue sales/service/recurring, will determine which will be used, but be prepared to offer up either one. Most buyers are interested in the calculation based upon revenue, not the number of customers.
If you are interested in learning more about these metrics, you will want to check out the chapters on Financial Fitness and Sales and Marketing, in Part II of my book, Get Acquired for Millions. These metrics along with others will help you prepare your company to achieve a higher multiple when you decide to sell.
